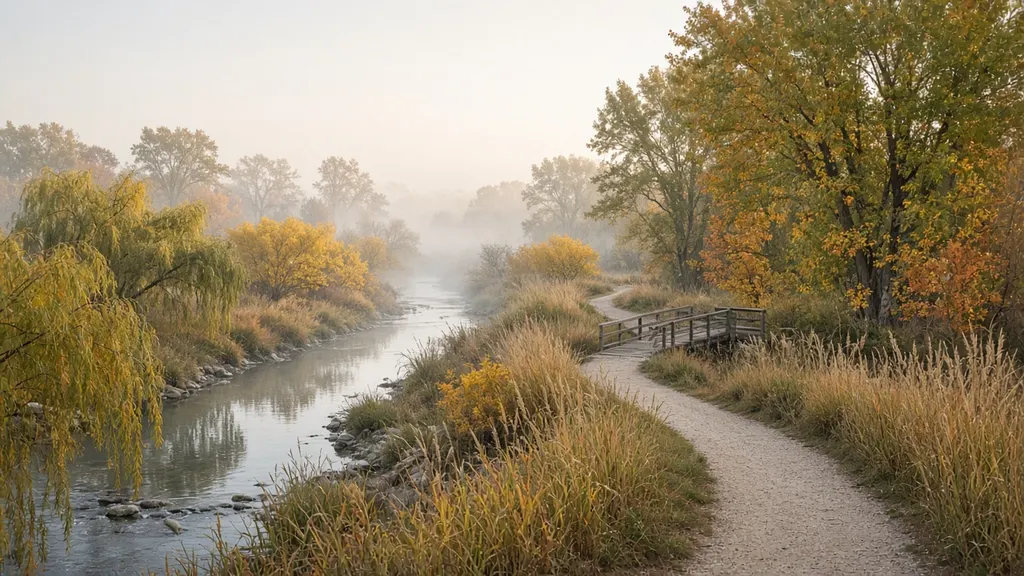
Site analysis before you draw: how to read a site in Lincoln
A step-by-step approach to site analysis for landscape architecture students: what to observe, how to document sun, wind, water, soils, circulation and use, and how to turn notes into diagrams that shape a design.

By Matthew Bovee · Upd. · 7 min
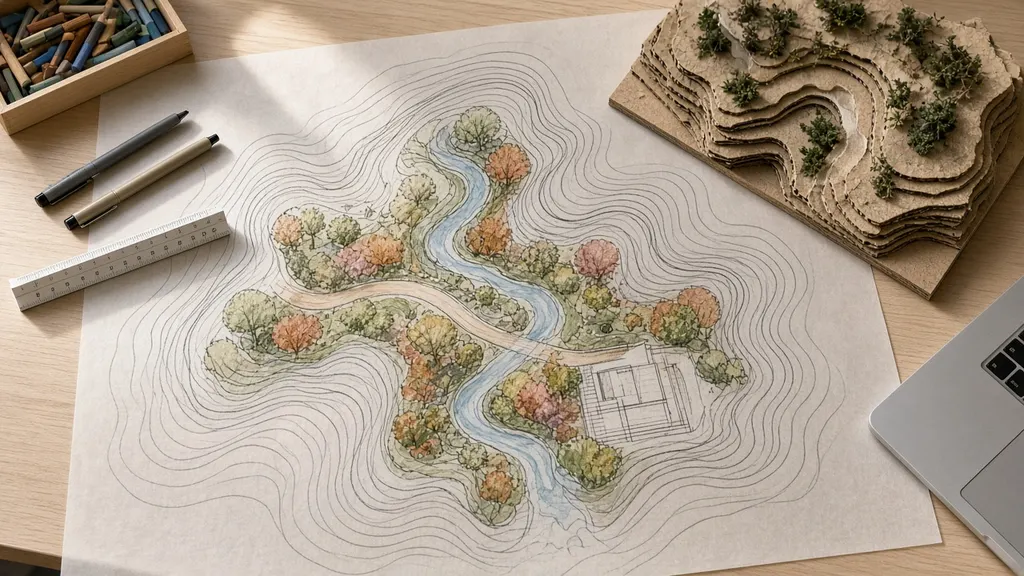
The fastest way to ruin a studio project is to start designing before you understand the site. I have done it. You arrive with an idea you are excited about, draw it onto the base map, and spend the next six weeks defending it against the site's reality. The better approach is slower at the start and much faster later: spend real time reading the site before you draw a single design line.
Site analysis is the process of observing, documenting and interpreting the conditions of a place. It sounds academic, but it is really just paying attention in an organized way. This article walks through how I approach it, with examples from sites around Lincoln.
Inventory versus analysis
It helps to separate two activities that often get blurred together.
- Inventory is collecting information: what is there? Slopes, soils, plants, buildings, utilities, paths, views, uses.
- Analysis is interpreting that information: what does it mean for the design? Where are the opportunities and constraints?
A map of every tree on a site is inventory. A diagram showing that the existing trees create a shaded edge perfect for seating is analysis. Both are needed, but analysis is what moves a project forward.
Before the visit: gather what you can
Before going to the site, I collect whatever background information is available:
- Aerial imagery and base maps, including historical aerials if possible, to see how the site has changed.
- Topography, usually as contours, to understand slopes and drainage.
- Soil information from public soil surveys.
- Floodplain and stormwater maps, especially near creeks.
- Zoning and land use, to understand what surrounds the site.
- Transit, bike and pedestrian networks, to see how people arrive.
This background helps me plan the visit and notice things I would otherwise miss.
On site: observe with all your senses
The site visit is where analysis becomes real. I try to visit more than once, at different times of day and, when possible, in different weather. A courtyard at noon in October is a different place from the same courtyard on a January evening.
What I document:
- Sun and shade. Where does the sun fall at different times? Which areas are shaded by buildings or trees?
- Wind. Where is it gusty or calm? Where do leaves and snow collect?
- Water. Where does water flow and pool? Look for stains, erosion and debris lines.
- Soil and ground. Is it compacted, wet, rocky or disturbed?
- Vegetation. What is growing, and is it healthy? Note significant trees.
- Circulation. How do people move through the site? Look for informal paths.
- Use. Who uses the site, when and for what? Where do people sit, gather or avoid?
- Views and edges. What do you see from the site, and what do others see of it?
- Sound and smell. Traffic noise, trains, restaurants, water — these shape experience.
- Feel. Does the space feel safe, exposed, intimate, neglected?
Talk to people
Analysis is not just about physical conditions. The people who use a site know things no map shows: where it floods, where it feels unsafe at night, what they wish it had. In studio we often do informal observation rather than formal engagement, but even a few conversations can change a project.
When I can, I note:
- Who is there at different times, and who is missing.
- What people say about the place, in their own words.
- What people do that the design should support or redirect.
Turning notes into diagrams
The heart of analysis is the diagram: a simple drawing that shows one idea clearly. Good analysis diagrams are focused. A single drawing that tries to show everything is unreadable.
| Diagram | What it shows | Design question it answers |
|---|---|---|
| Sun and shade | Light at different times and seasons | Where should people sit or plants grow? |
| Wind | Prevailing winds and sheltered areas | Where is shelter needed? |
| Drainage | Water flow and low spots | Where can stormwater be managed? |
| Circulation | Paths, desire lines, entries | How should people move through? |
| Views | Good views and views to screen | What should be framed or hidden? |
| Use | Activity patterns | What spaces are needed and where? |
| Opportunities and constraints | A synthesis of all of the above | Where should design moves go? |
The final opportunities-and-constraints diagram is where analysis turns into design direction. It should be the bridge to your first concept sketches.
Synthesis: from observations to a design idea
Once the diagrams are drawn, the question is what they add up to. I try to write a short paragraph that summarizes the site's character and the key design challenge. For example:
The plaza is sunny and exposed, windy from the northwest in winter, and crossed diagonally by people who ignore the existing walks. The design should give shelter on the north side, keep the diagonal, and create a sunny place to sit.
That paragraph becomes the test for every design idea that follows. If a concept does not respond to it, it is probably not the right concept.
Examples from Lincoln sites
A few patterns I have noticed on sites around Lincoln:
- Wind matters more than expected. Open sites, parking lots and gaps between buildings are often windy in every season. Analysis of winter conditions often changes the layout of outdoor spaces.
- Water collects in surprising places. Even sites that look flat often have low spots that hold water after storms — opportunities for rain gardens and bioswales.
- Desire lines tell the truth. Worn paths across lawns show where people really walk.
- Creeks connect more than they divide. Near Lincoln's creeks, analysis often reveals how a site links to a larger trail and open-space network.
A worked example: a small neighborhood park
To make this concrete, here is how analysis shaped a simplified version of a small neighborhood park study.
Inventory recorded a gently sloping lawn, a row of mature trees along the west edge, a playground in the northeast corner, a worn path diagonally across the lawn, a low area near the southeast corner that held water after storms and a busy street along the south side.
Analysis turned that into a few findings:
- The worn diagonal path connected a bus stop to a residential street. It was the main way people used the park.
- The low corner received runoff from the lawn and the street, and it stayed muddy for days.
- The mature trees made the west edge the most comfortable place in summer, but it was the windiest edge in winter.
- Traffic noise made the south edge unpleasant to linger near.
Synthesis produced one statement: the park is a crossing first and a destination second; the design should make the crossing better, turn the wet corner into an asset and give people a sheltered, quieter place to sit away from the street.
From there, early concepts almost drew themselves: a paved path along the existing diagonal, a rain garden in the low corner, seating under the trees with a planted buffer to the north for winter wind, and a dense planting edge along the street to soften noise and views.
Documenting analysis for reviews and portfolios
Analysis is only useful if others can follow it. I try to present it as a short sequence rather than a wall of maps:
- Context: where the site is and how it connects to its surroundings.
- Three to five focused diagrams, each showing one finding.
- Opportunities and constraints, combining the findings.
- The written statement of the design challenge.
Keeping diagrams in a consistent graphic style — the same base, line weights and color for each layer — makes the sequence easy to read. It also makes the analysis feel like part of the design rather than a separate assignment.
Tools that help
Simple tools are usually enough: printed base maps, trace paper, a camera and a notebook. Digital tools can help with sun studies, slope analysis and mapping, and public datasets cover soils, floodplains and land use. The tool matters less than the habit of observing carefully and writing down what you notice.
Common mistakes
- Collecting without interpreting. A stack of inventory maps is not analysis.
- Visiting once. One visit rarely captures how a site changes.
- Ignoring people. Physical analysis alone misses how a site is used.
- Overloading diagrams. One idea per diagram.
- Skipping synthesis. Without a summary, analysis does not shape design.
A checklist for site analysis
- Background information is collected before the visit.
- The site is visited at least twice, at different times.
- Sun, wind, water, soils, vegetation, circulation, use and views are documented.
- At least a few people who use the site are observed or asked.
- Each diagram shows one idea clearly.
- An opportunities-and-constraints diagram synthesizes the findings.
- A short written summary states the key design challenge.
Site analysis is the part of a project that rarely makes it onto the final board, but it is what makes the final board convincing. In my projects, I try to show the analysis alongside the design for exactly that reason. And if you are building a portfolio, the portfolio guide explains how to present this kind of process work.
Last updated
Keep reading
Keep reading
7 min
For students
How to build a landscape architecture student portfolio that shows how you thinkA practical guide for landscape architecture students: choosing projects, structuring case studies, showing process as well as finished drawings, writing captions, and keeping a portfolio honest and easy to read.7 min
Public space
Designing public space for Nebraska wintersHow to design plazas, streets and small parks in Lincoln that stay useful and attractive from November to March: sun, wind shelter, snow storage, materials, lighting, planting and programming for cold months.
7 min
Urban streams
Designing trails and edges along Lincoln's creeksHow landscape architects approach urban stream corridors in Lincoln: floodplains, stable banks, riparian planting, trail alignment, access to water and the long view of a creek as a shared public space.